
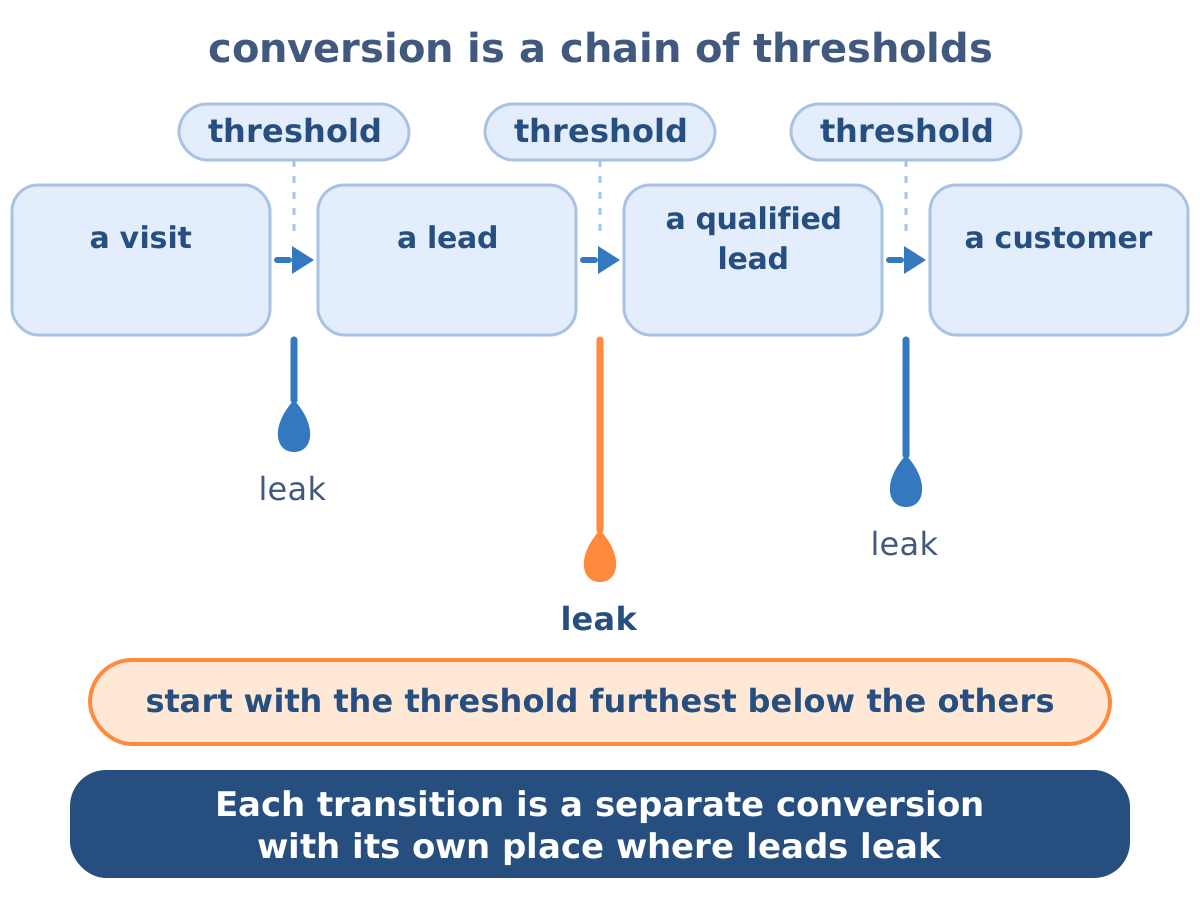
Lead conversion is the moment a contact changes status: a visitor becomes a lead, a lead becomes qualified, and a qualified lead becomes a customer. The conversion rate says what share crosses each of those thresholds, and it is the basic measure of whether lead generation is earning or only spending.
Conversion happens in a series rather than a single jump, so each threshold has its own rate and its own way of leaking. This page covers how to calculate the rate, what a good rate actually depends on, what moves it, and how to raise it — from the landing page through to a testing cycle.
What is lead conversion?
Lead conversion is the transformation of potential customers into paying customers through a sequence of stage transitions: from an anonymous visit, through leaving contact details, through qualification, to a signed agreement.
Each transition is a separate conversion with a separate rate and a separate place where the process can leak. Three of them carry names worth keeping distinct:
Web-to-lead
a visitor submits a form and the data reaches the CRM automatically as a new lead. From that moment the contact is inside the process.
Marketing conversion
a lead becomes a marketing qualified lead by meeting the agreed criteria.
Lead-to-sale
a qualified lead becomes a paying customer.
Treating these as one number is the most common reason a conversion problem stays undiagnosed, because a single figure at the end of the chain gives no indication which threshold produced it.
How do you calculate the lead conversion rate?
The lead conversion rate is the number of conversions divided by the number of entries to a given threshold, expressed as a percentage. Across the full path it is new customers divided by leads acquired in the same period.
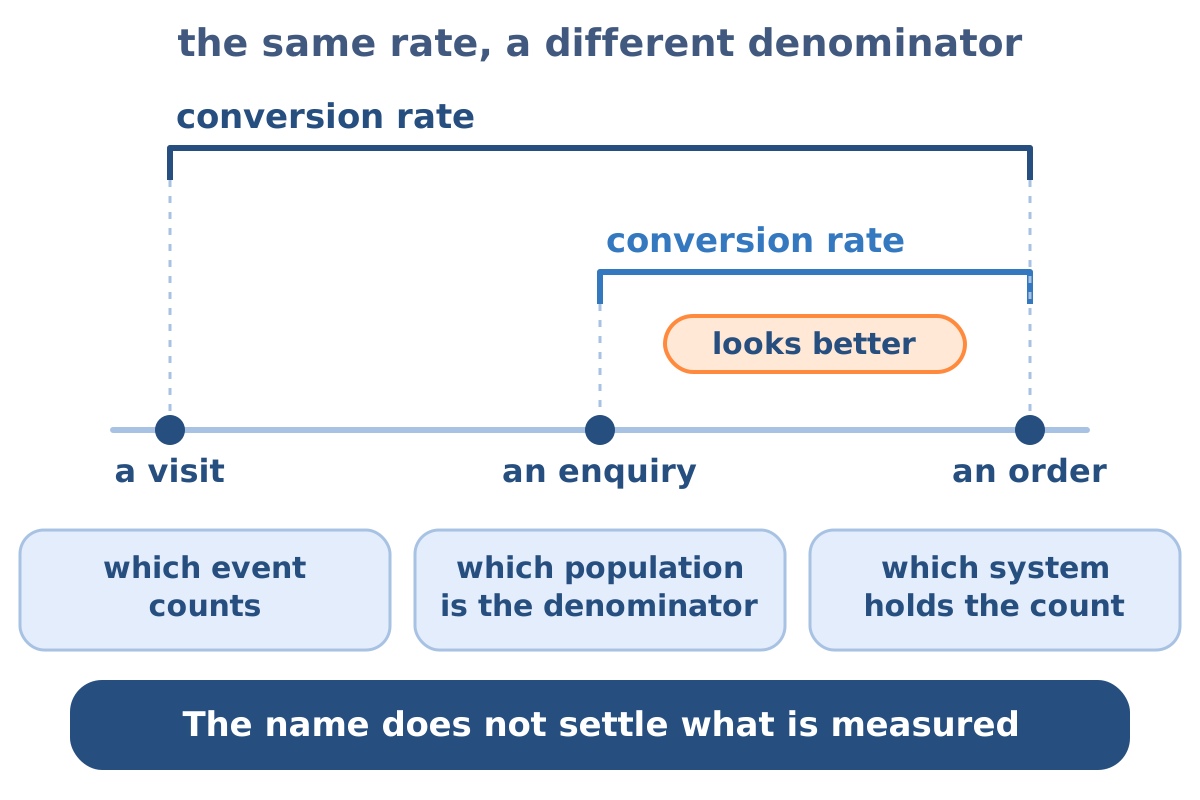
The formula is trivial and the denominator is where the meaning lives. Two companies reporting the same number can be measuring entirely different things — one counting conversion from an enquiry, the other from a visit — and the first will always look better. Before a rate is compared to anything, three things have to be fixed: which action counts as a conversion, which population forms the denominator, and which system holds the authoritative count.
Two rates measured on the drySEO laboratory's own B2B account show what the discipline produces (drySEO lab data):
- Visit to commercial enquiry: 0.7–0.8% — all users of the knowledge site divided by commercial enquiries recorded in the CRM. The ratio crosses a system boundary, so it reads as an order of magnitude.
- Enquiry to order: 13.6% — orders divided by commercial enquiries excluding noise, range 11.6–15.0% depending on the denominator, measured from full-year exports.
Those two figures sit several orders of magnitude apart while both being called a conversion rate, which is the clearest demonstration available that the threshold has to be named alongside the number.
What is a good lead conversion rate?
A good lead conversion rate is one that is improving against your own previous measurement on the same denominator — and published cross-industry benchmarks are the weakest available answer to this question.
The reason is structural. A benchmark quoted without its denominator is compatible with almost any account, because the choice of denominator alone moves the result by an order of magnitude. The same effect is visible in cost data from the laboratory's own account: cost per lead comes out at PLN 73, PLN 237 or PLN 452 on the same spend and the same foreign markets, a 6.2× spread, purely from what counts as a lead in the denominator (drySEO lab data). A conversion benchmark carries exactly the same weakness.
There is a second reason to treat external targets carefully. Close rate varies by market more than most calculations assume: alongside the measured 13.6% stands a directional observation from the laboratory's own practice that on markets furthest from a client's core business the same ratio can run at roughly 5–6% (drySEO lab data, directional from practice, not an export — same denominator). At a distance of about 2.5×, a single target applied across markets will mislead on at least one of them.
The workable approach is to set the baseline from your own data, split it by threshold, and measure movement against it. Where an external comparison is genuinely needed, compare against figures that publish their denominator and discard the rest.
What is the difference between lead generation and lead conversion?
Lead generation produces contacts; lead conversion moves them across thresholds. The boundary falls at the moment contact details are captured — generation works up to that point, conversion works from it onward and again at every subsequent stage.
The distinction has operational consequences that make it worth keeping sharp. The two are measured on different denominators: generation on traffic and cost, conversion on transitions between defined stages. They fail differently — weak generation shows up as too few contacts at any price, weak conversion shows up as plenty of contacts and few orders. And they are fixed differently: generation responds to channel, targeting and budget, while conversion responds to the landing page, the response time and the qualification criteria.
Confusing them produces a predictable and expensive mistake, which is buying more traffic to solve a problem that lives after the form. The diagnostic that separates the two takes one afternoon: split the path into thresholds and calculate each rate. The stage that sits furthest below the rest names which of the two disciplines the quarter belongs to.
What affects lead conversion?
Four factors account for most of the result, and they are listed here in the order in which they can be influenced.
Lead fit
Contacts from outside the target audience convert at a negligible rate whatever is done to the page, which means conversion is raised during targeting rather than after it. This is also why a rising conversion rate sometimes accompanies falling lead volume and still represents an improvement.
Response speed
The window in which a contact is still warm is measured in minutes rather than days, because a buyer usually submits more than one form and the conversation goes to whoever replies first. This is the cheapest single improvement available in most funnels.
Message match
The offer and the content have to answer the problem the lead arrived with. A promise made in an ad or a search result that fails to reappear in the page heading produces an immediate exit.
Trust
References, case studies and recognisable client logos remove risk from the decision, and their effect concentrates exactly where hesitation does — beside the form.
Conversion also has a financial dimension that compounds: customer acquisition cost is the cost of a lead divided by the conversion rate, so doubling the rate halves the cost of a customer with the budget unchanged. The denominators behind that arithmetic are set out in the cost guide.
The landing page: where conversion happens
A landing page is a page designed around a single action — leaving contact details — and its discipline is subtraction: one goal, one message, one form.
Five elements carry an effective landing page:
- A heading matched to the traffic source. The promise from the ad or the search result returns in the heading, so the visitor's first half-second confirms they are in the right place.
- Value in exchange for contact. Something specific that the user receives for completing the form: a quotation, a document, a consultation — named explicitly.
- A short form. Every field costs conversion. Ask only what is needed to qualify the lead, and leave the rest to the conversation.
- One call to action. A visible button stating what happens after the click. A second goal on the page competes with the first.
- Social proof and speed. References or logos beside the form remove risk, and the page has to load fast on a phone, since a slow page loses traffic before showing anything.
Which touchpoints make up the visible layer of conversion?
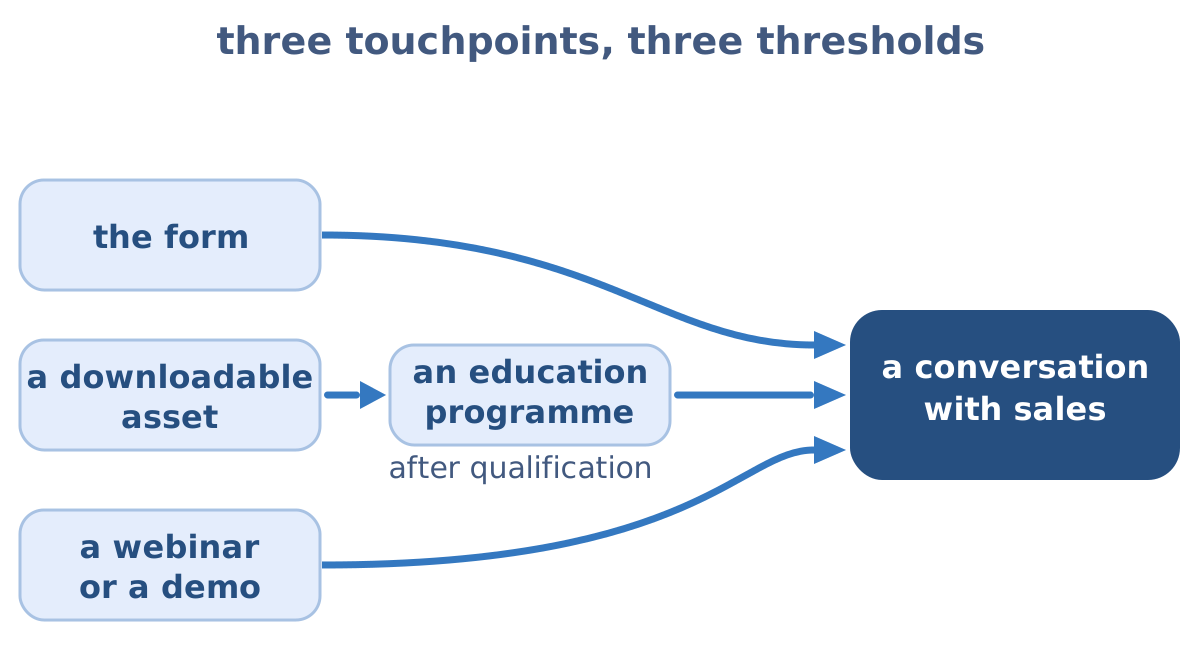
Three touchpoints make up the visible layer, and each is where a user hands over contact details: the form on a landing page, a downloadable asset, and registration for a webinar or a demo. Each is a separate threshold with its own rate, because the person reaching for it stands at a different point in the decision.
- The form collects submissions from people ready to talk — highest intent, lowest volume, shortest route to a conversation.
- The downloadable asset — a report, a calculator, a specification — collects contacts in the research phase. That lead enters an education programme first and reaches sales after qualification.
- The webinar or demo carries both roles. Registration happens early, while attendance itself is a readiness signal that raises the priority of the contact.
Reporting the three separately is what makes the figures comparable. A combined rate calculated over all submissions moves whenever the mix between them moves, even with every individual threshold holding steady.
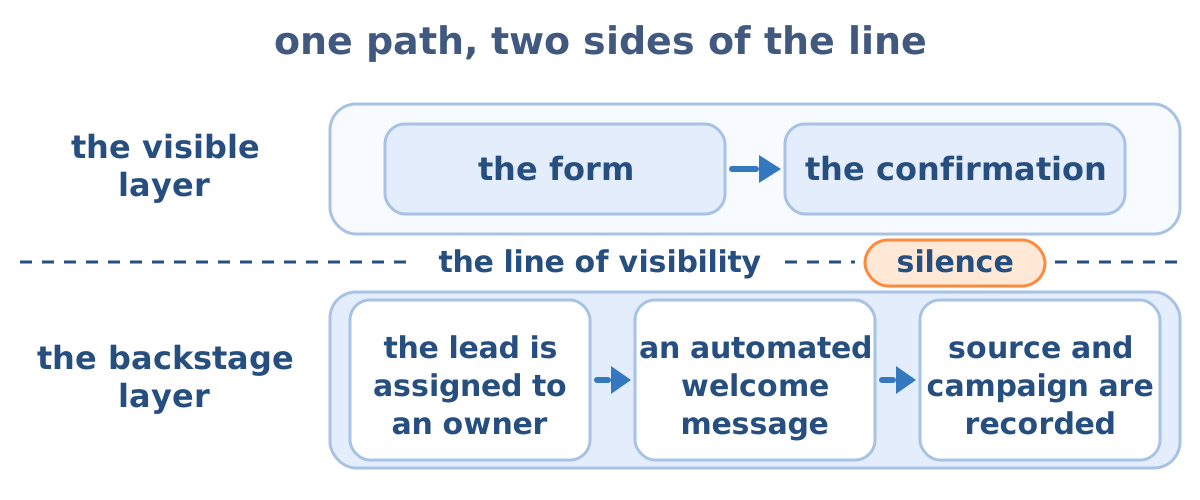
Behind each submission runs a sequence the user never sees: the lead is assigned to an owner, an automated welcome message goes out, and the source and campaign parameter are written into the record. A service blueprint splits a path into a visible layer, a backstage layer and a supporting layer; on a conversion path the decisive boundary is the line of visibility, because the silence a user feels after submitting a form is produced on the far side of it. Improving conversion past the form therefore starts backstage, which is the work described on Lead Management.
Why does a technically clean path still lose leads?
A clean path loses leads in the experience layer — the tone, the effort each step demands, and whether the visitor feels invited or interrogated. A journey map describes the sequence of steps; experience describes what passing through them feels like, and two companies with identical sequences can produce different results for that reason alone.
Value goes before the request for data
Someone who has already received concrete help has a reason to leave their details. Publishing part of the material openly and placing the form beside the item a convinced reader reaches for — an industry report, a quotation, access to a calculator — puts the exchange in the order that builds trust first.
Friction is measured in fields, clicks and ambiguities
Every field whose purpose the user fails to understand is a cost, and microcopy beside it (“phone number so we can confirm a time”) removes resistance more cheaply than any change of layout. Live validation, mobile handling and a short route to submission do the rest. Tools framed as “calculate” or “check” — a calculator, a qualifying quiz — meet less resistance than a “sign up” button, because they return a result immediately and the contact details are the price of the result.
Openness about the rules is a trust signal
Stating plainly why the data is collected, who will make contact and what to expect reduces the fear of spam, which is what most often stops a cursor above a button. Marketing consent treated as a first act of trust works on conversion in a way a compliance checkbox does not.
Response time is the most keenly felt element of the experience
Two changes shorten it without adding people: automatic assignment of each submission to a named owner the moment the form is sent, and immediate delivery of the promised value, so the material arrives in seconds.
Experience quality is measured differently from cost per lead
A falling cost per lead alongside a rising count of enquiries that sales cannot close is a warning signal. Two measurements complete the picture: a quality rating applied to each lead at handover, and a question put to those who declined, since the reason for a refusal is the cheapest available knowledge about where the path loses people.
What is conversion rate optimisation (CRO)?
Conversion rate optimisation is a repeatable cycle: measure where the path leaks, form a hypothesis about why, test a change, deploy the winner, and start again.
Analytics supplies the where — the stage at which users drop out — and behavioural tools such as heatmaps and session recordings supply the why. Changes are verified by an A/B test, two versions of a page served in parallel, under two rules: test one element at a time, since parallel changes leave the result ambiguous, and let the result reach statistical significance before deciding. CRO covers the whole user path on the site; landing page optimisation is the subset focused on the place where conversion actually occurs.
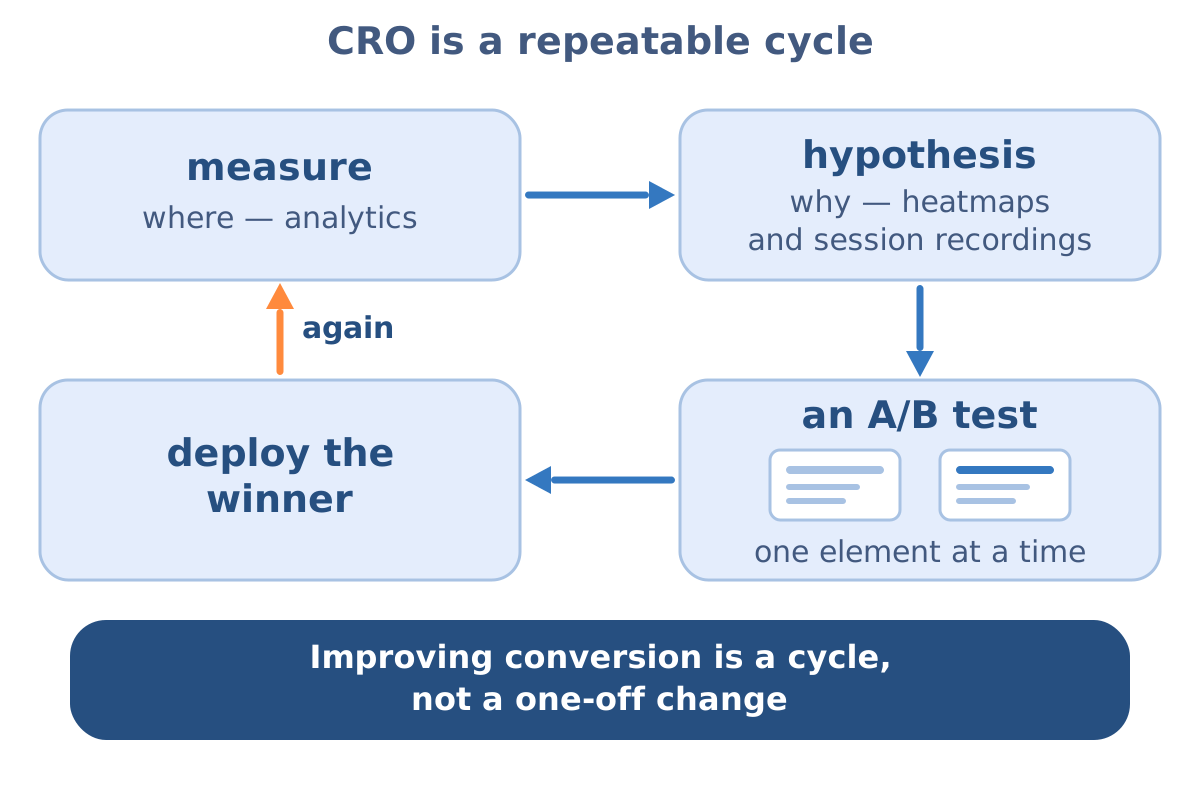
The sequence matters more than the tooling. Measurement per threshold comes first, because most reported conversion problems turn out to belong to one specific threshold, and the path has to be split into rates before anyone can say which.
Do Core Web Vitals change the conversion rate?
Core Web Vitals are three measurements taken from real visits rather than from a test run: how long the main content takes to appear (largest contentful paint), how quickly the page answers the first tap (interaction to next paint), and how much the layout moves while it is still loading (cumulative layout shift). Whether improving them moves a conversion rate is a question each site answers on its own data; no figure for that effect appears on this site, because the laboratory's measurement does not contain one.
What can be said without a figure is where the cost falls, and it is not spread evenly along the path. A slow article loses a reader who was only learning, and that loss is cheap. A form that shifts under the thumb, or does not answer the first tap, loses an enquiry from someone who had already decided to make contact — and that loss is invisible in a traffic report, because the visit happened and the page was read.
The measurement also stops earlier than the path does. It describes the page up to the moment the button is pressed; the server's answer, the confirmation screen and the first reply from a person all fall outside it, and that is usually where the wait a visitor remembers actually sits. So the work that follows is practical rather than technical: measure on the pages holding a form, on a phone, and read the result in enquiries per visit with the denominator stated. A tool's score describes the page; the enquiry is what the page was built for.
How does lead conversion work inside a CRM?
Inside a CRM, conversion is a status change plus the records it creates: the lead object becomes a contact with an associated company and an open opportunity, and the history of the lead carries across so the interaction record survives the transition.
Three properties make this worth designing rather than accepting by default. The conversion has to be reversible or at least correctable, because leads get converted early and the audit trail matters. Field mapping has to be decided in advance, since anything left unmapped at the moment of conversion is silently lost from reporting. And the timestamp of the conversion is what makes cycle length measurable later.
This is also where the two systems most often disagree. Measurement on the laboratory's own account showed the ad panel counting 1.4–1.9× fewer conversions than the CRM — leads carrying a campaign parameter found in the CRM, divided by the conversions counted in the panel, with a control from a third system agreeing to within 0.4 percentage points (drySEO lab data). The direction is one-sided: the panel sees fewer. Reconciling the two is the work that makes a conversion report trustworthy, and it is covered in our lead management guide.
Which lead conversion metrics should you track?
Track four, each answering a question the others cannot.
Conversion rate per threshold
where the path leaks. This is the diagnostic that locates every other problem.
Time to conversion
how long a lead takes to cross a threshold, which turns a stalled pipeline into a visible number.
Cost per conversion
what each threshold crossing costs, always with its denominator attached.
Lead quality at handover
a rating applied by sales, which is what keeps a rising conversion rate honest.
What are the most common mistakes in lead conversion?
Five mistakes recur. A landing page that distracts, carrying a menu, links and three goals instead of one. A form asking for data nobody wants to give at that stage. Missing follow-up, where a lead leaves contact details and waits a week. A page that loads slowly or breaks on a phone. And measuring only the end of the path, which leaves the leaking threshold invisible.
Frequently asked questions
Is lead conversion the job of the sales department?
It is shared. Marketing owns the conversions at the top of the path, sales owns the bottom, and the result depends on the handover between them. Disputes about lead quality are settled by a shared definition of the thresholds plus both teams seeing the same numbers.
What is the difference between UX and CX in lead generation?
UX concerns a single interface: whether the form is legible and easy to complete on a phone. CX covers the sum of impressions along the whole route — the ad, the page, the first conversation, the waiting time. Good form UX is a precondition for good CX and is insufficient alone: a form completed in five seconds still disappoints if silence follows it.
How does lead nurturing improve conversion?
Most B2B leads are unready at first contact, and an immediate sales attempt converts a “later” into a refusal. Nurturing holds the contact until readiness arrives, and how those sequences are built is covered on the lead nurturing page.
Where should conversion optimisation start?
With measurement per threshold. Map the path into stages, calculate each transition, and begin with the threshold sitting furthest below the others, because that is where an improvement carries furthest.
How do qualification and scoring raise conversion?
Conversion calculated across all leads mixes valuable contacts with incidental ones. Qualification removes the second group and scoring sets the contact order, so the same sales effort produces more transactions.