
A lead generation funnel is a model of the route a buyer takes from first contact with a brand to a completed purchase, divided into stages through which a steadily smaller number of people passes. The funnel is what gives B2B lead generation its order — every contact acquired has a place in it and a defined next step. This page covers the four stages, the same funnel in figures from our own measurement — set against the template that circulates in the industry — how to build a funnel in five steps, how to find where it leaks, and how a lead generation funnel differs from a sales funnel.
What is a lead generation funnel?
A lead generation funnel (also called a marketing funnel or a purchase funnel) is a way of picturing the sales process: a wide group of potential customers enters at the top, and closed transactions leave at the bottom. Its shape comes from the nature of the process — at every stage some people leave, and the ones who stay are the ones whose interest is growing.
The model rests on the classic AIDA sequence — attention, interest, desire, action. In practice most companies divide the funnel more simply, into top, middle and bottom, and assign different marketing and sales activity to each part.
What are the stages of a lead generation funnel?
A lead generation funnel runs in four stages, from awareness to purchase, and each stage has a different job.
Awareness (top of the funnel, TOFU)
The prospect learns that the brand exists — through a search engine, an ad, a referral or a professional network. The goal of this stage is reach and recognition; a sale here would be premature.
Interest (middle of the funnel, MOFU)
The buyer compares solutions and looks for knowledge. The company supplies content that answers the questions being asked and collects contact details in exchange. This is where a lead is born.
Decision (bottom of the funnel, BOFU)
The buyer chooses a supplier, and evidence carries the weight: case studies, references, a quotation, a conversation with a salesperson.
Purchase
The transaction closes the funnel, and post-sale service opens the next one, because a satisfied customer returns and recommends.
Every stage has its own transition rate, and a drop between stages is normal; what deserves attention is a drop steeper than the one the same funnel produced last quarter.
Can you give an example of a lead generation funnel?
Here is a funnel built entirely from rates measured on the drySEO laboratory's own B2B account over a full year, read nine months after the period closed so that long-cycle enquiries had time to close. Every number can therefore be traced to a denominator rather than to an illustration.
Two measured transition rates define it (drySEO lab data):
Visits to commercial enquiry: 0.7–0.8%
all users of the knowledge site ÷ commercial enquiries recorded in the CRM. The ratio crosses a system boundary, so it reads as an order of magnitude.
Enquiry to order: 13.6%
orders ÷ commercial enquiries excluding noise, with a range of 11.6–15.0% depending on the denominator, measured from full-year exports.
Apply those to a round traffic figure and the arithmetic follows: 10 000 visits to a knowledge site produce roughly 70 to 80 commercial enquiries, and those enquiries produce roughly 10 orders. The step that moves the result most is the first one — an improvement of a tenth of a percentage point at the top changes the order count by more than a several-point improvement in closing does, simply because it acts on a much larger base.
One widely circulated template says otherwise, and it is worth checking before it becomes a plan. It is repeated in training material without a single identifiable source, and it holds that 5% of visitors become leads, 30% of leads pass qualification and 15% of those buy.
Set against the measurement, the template diverges at both ends of the funnel: it puts the top 6–7× too high, and the close — once its own two lower thresholds are composed, 30% × 15%, or 4.5% of enquiries turning into orders — 3× too low. The middle threshold, those 30% of enquiries passing qualification, cannot be set against the measurement at all: this CRM holds no separate marker for the qualification stage, so there is no denominator for it.
The template is therefore wrong twice and in opposite directions. The 5% did not come from nowhere: it is a realistic conversion rate for a campaign landing page, where the visitor arrived on a single offer and the page asks one question. Applied to a whole knowledge site it overstates the top of the funnel, and that is the entire difference; ten such comparisons, each with its denominator, are collected separately.
The practical consequence for a funnel is single: check the stages separately, each against its own denominator. Multiplying template thresholds together produces a figure that belongs to no measurement — and that looks exactly like a result.
How do you build a lead generation funnel?
Building a funnel takes five steps, and they run in this order because each one supplies what the next needs.
Define the target audience
A funnel built before this collects contact details at random. The method is set out on Target Audience.
Plan the entries
Choose one or two channels that will bring people to the top: organic search, paid search, a professional network.
Design the conversion point
A landing page carrying a form and something of value in exchange for contact details.
Set the transition criteria
Define when a contact becomes a lead, when a lead becomes qualified, and when it reaches a salesperson.
Measure every stage
Transition rates between stages show where the funnel leaks and therefore where investment returns most.
The fourth step is the one most often skipped and the one that decides whether the other four produce comparable numbers. Written criteria turn a disagreement about lead quality into a question with an answer, and the criteria themselves are covered in the qualification guide.
How can you optimise a lead generation funnel for better conversion?
Optimise a funnel by finding the stage with the lowest transition rate and working on that stage alone, because effort spent anywhere else is capped by the bottleneck ahead of it.
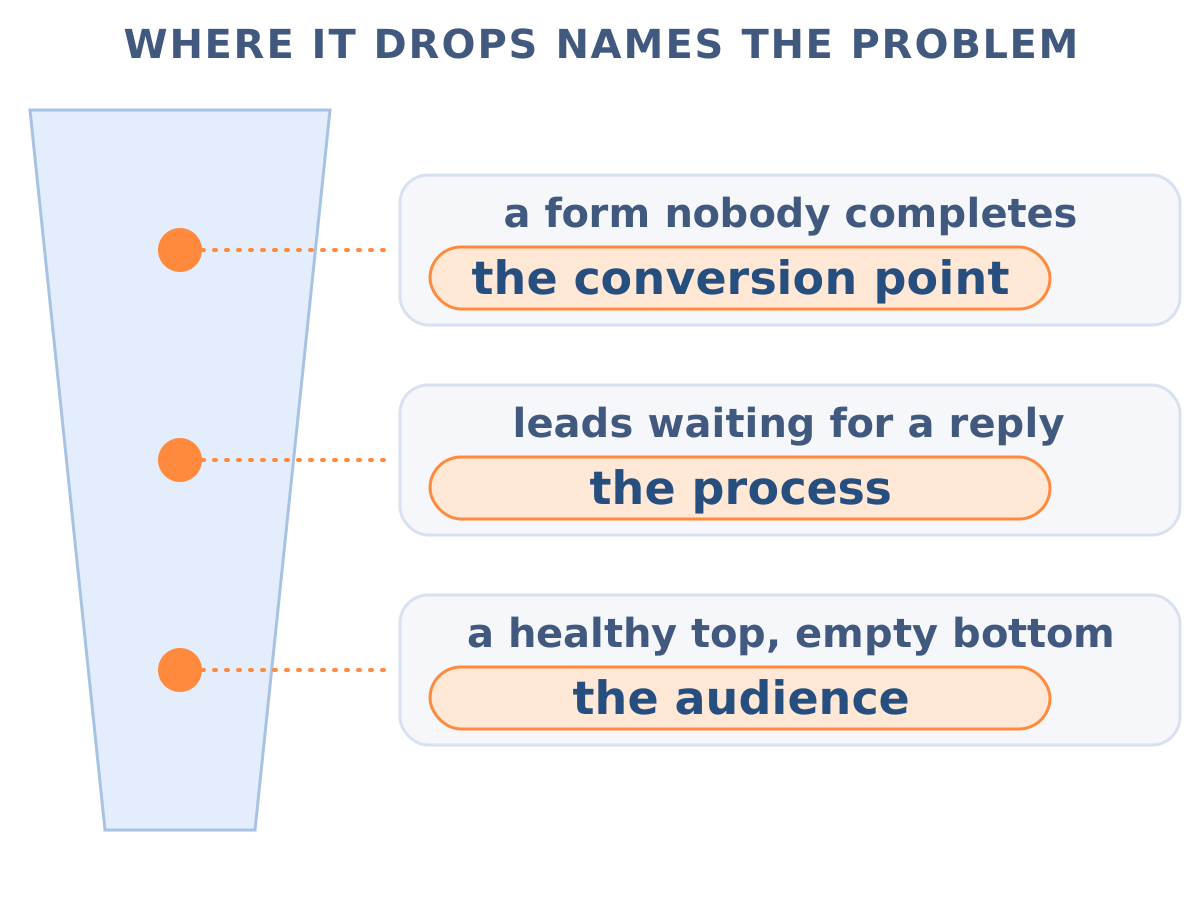
Three bottlenecks account for most cases:
A form nobody completes
The conversion point is the problem: the offer, the page, or the number of fields. This is the highest-leverage fix in most B2B funnels, because it sits on the largest base.
Leads waiting for a reply
The process is the problem, and the fix is an owner and a response time rather than more traffic.
A healthy top with an empty bottom
The audience is the problem: the funnel is attracting people who resemble buyers and cannot buy. Dividing the base and measuring each part separately locates it, as described on B2B Target Audience.
Two habits make the optimisation durable. Measure each stage against its own denominator and against the same funnel's previous period, since an external benchmark quoted without its denominator is compatible with almost any account. And change one stage at a time — parallel changes produce a result that can be read several ways.
What is the five-minute rule for leads?
The five-minute rule is the claim that a lead contacted within a few minutes of enquiring converts far better than one contacted a day later. The mechanism behind it is sound: an enquiry is made at a moment of active interest, the buyer is usually contacting several suppliers in the same session, and the first substantive reply frames the comparison.
The specific multipliers attached to this rule in circulating articles remain unverified in the laboratory's own data, so this page states the mechanism and leaves the figures to whoever can supply a denominator for them. What the direction supports in practice is modest and useful: route enquiries to an owner automatically, treat a same-working-day reply as the floor, and record the interval so it becomes a number you own. The record that carries that interval is covered in our lead management guide.
What is the difference between a lead generation funnel and a sales funnel?
A marketing funnel covers the top and middle of the buyer's route — from first contact to the handover of a lead to sales — while a sales funnel in the narrow sense covers the bottom, from a qualified lead to a transaction. In practice both terms describe one process and most companies use them interchangeably.
What matters more than the naming is that marketing and sales work from shared stage definitions, because leads are lost at the seam between departments when the two sides label the same record differently. A pipeline is a third term in the same area: it names the deals a salesperson is working, which is the bottom of the funnel viewed as a workload rather than as a conversion sequence.
How does a B2B funnel differ from a B2C funnel?
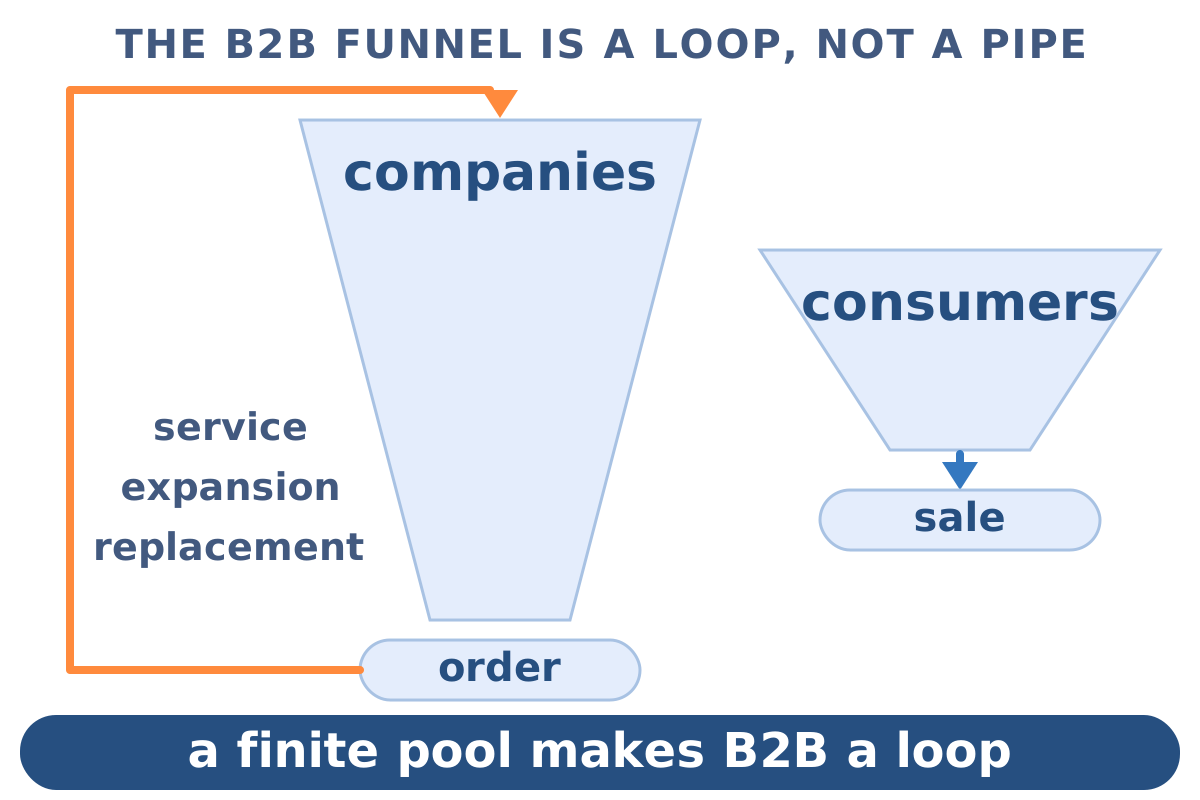
A B2B funnel is longer and narrower: a committee decides, the cycle runs for weeks or months, and the pool of potential customers is finite. That finiteness has a practical consequence — a contact acquired once returns to the funnel on a cycle, at service, expansion or replacement, instead of expiring after a first refusal. A B2C funnel is shorter and wider: one person decides, often quickly, and volume compensates for a lower transaction value.
How do qualification and nurturing work inside the funnel?
Qualification assigns leads to stages: a marketing qualified lead sits in the middle, a sales qualified lead at the bottom. Leads that stall in the middle are warmed by nurturing sequences until the decision matures, and the point where a lead commits is covered in the conversion guide.
Frequently asked questions
Can a company run several funnels at once?
Yes — a separate funnel for each product line, market or customer segment. The condition is separate measurement, because combined numbers from different funnels average away the very differences the split was made to reveal.
What is a lead magnet and where does it fit?
A lead magnet is value handed over in exchange for contact details — a report, a calculator, a webinar seat — and it sits at the conversion point between awareness and interest. Its job is to make the exchange worth completing for someone who is still researching.
What tools does a funnel need?
One is essential: a CRM that assigns every contact to a stage and counts the transitions. Everything else — email automation, analytics, form builders — extends a funnel that already has stages and owners. The categories are compared in the marketing automation guide.
What are the key metrics for a funnel?
The transition rate at each stage, plus cost per lead and close rate across the whole. Each transition rate answers a local question, and the two end-to-end figures answer whether the funnel pays. Denominators for the cost figure are worked through in the cost guide.
Where should optimisation start?
At the top, in most B2B funnels. The visit-to-enquiry step operates on the largest base, so a small improvement there moves more orders than a large improvement at the close.